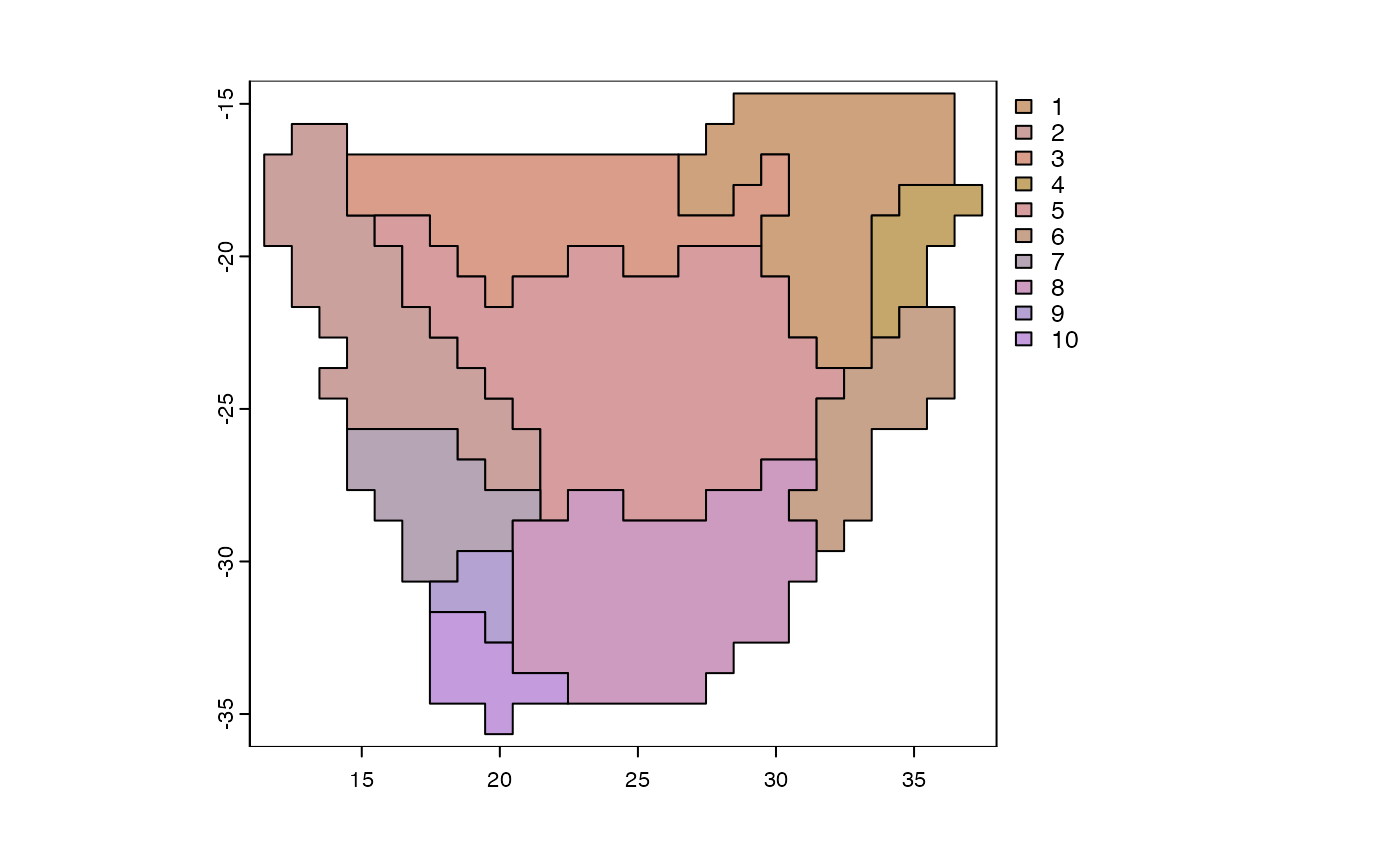
Visualize biogeographic patterns
# S3 method for phyloregion
plot(x, pol = NULL, palette = "NMDS", col = NULL, label = FALSE, ...)

plot_NMDS(x, ...)

text_NMDS(x, ...)
Arguments
- x
an object of class phyloregion from
phyloregion- pol
a polygon shapefile of grid cells.
- palette
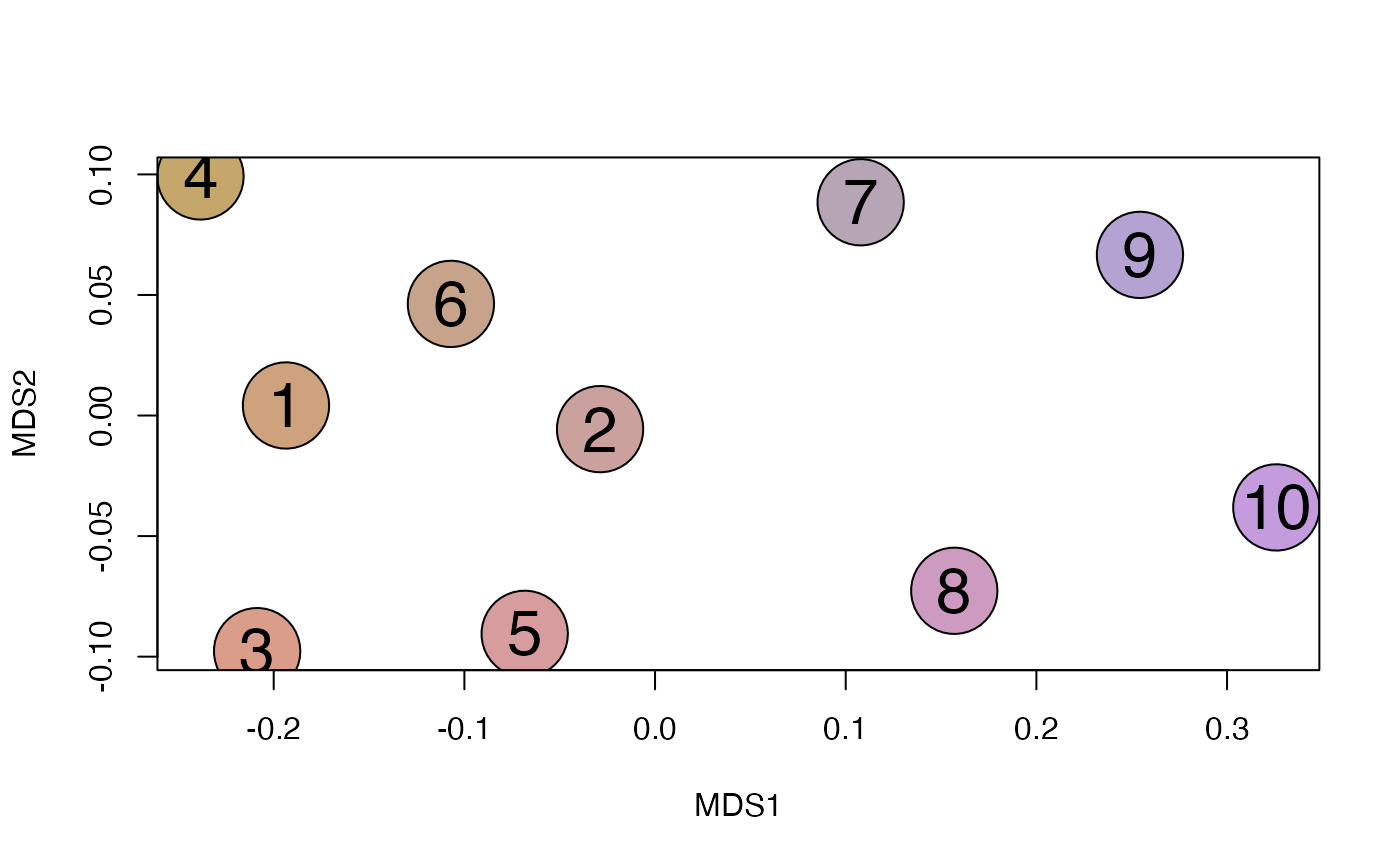
name of the palette to generate colors from. The default, “NMDS”, allows display of phyloregions in multidimensional scaling color space matching the color vision of the human visual system. The name is matched to the list of available color palettes from the
hcl.colorsfunction in thegrDevicespackage.- col
vector of colors of length equal to the number of phyloregions.
- label
Logical, whether to print cluster names or not
- ...
arguments passed among methods.
Value
No return value, called for plotting.
Examples
library(terra)
data(africa)
tree <- africa$phylo
x <- africa$comm
p <- vect(system.file("ex/sa.json", package = "phyloregion"))

subphy <- match_phylo_comm(tree, x)$phy
submat <- match_phylo_comm(tree, x)$com

pbc <- phylobeta(submat, subphy)
y <- phyloregion(pbc[[1]], pol=p)
#> Warning: convex combination of colors in polar coordinates (polarLUV) may not be appropriate
#> Warning: convex combination of colors in polar coordinates (polarLUV) may not be appropriate

plot_NMDS(y, cex=6)
#> Warning: convex combination of colors in polar coordinates (polarLUV) may not be appropriate
#> Warning: convex combination of colors in polar coordinates (polarLUV) may not be appropriate
text_NMDS(y, cex=2)

plot(y, cex=1, palette="NMDS")
plot(y, cex=1)
plot(y, cex=1, palette="NMDS")
plot(y, cex=1)