This function contrasts different hierarchical clustering algorithms on the phylogenetic beta diversity matrix for degree of data distortion using Sokal & Rohlf’s (1962) cophenetic correlation coefficient.
select_linkage(x)Arguments
- x
a numeric matrix, data frame or "dist" object.
Value
A numeric value corresponding to the good clustering algorithm for the distance matrix
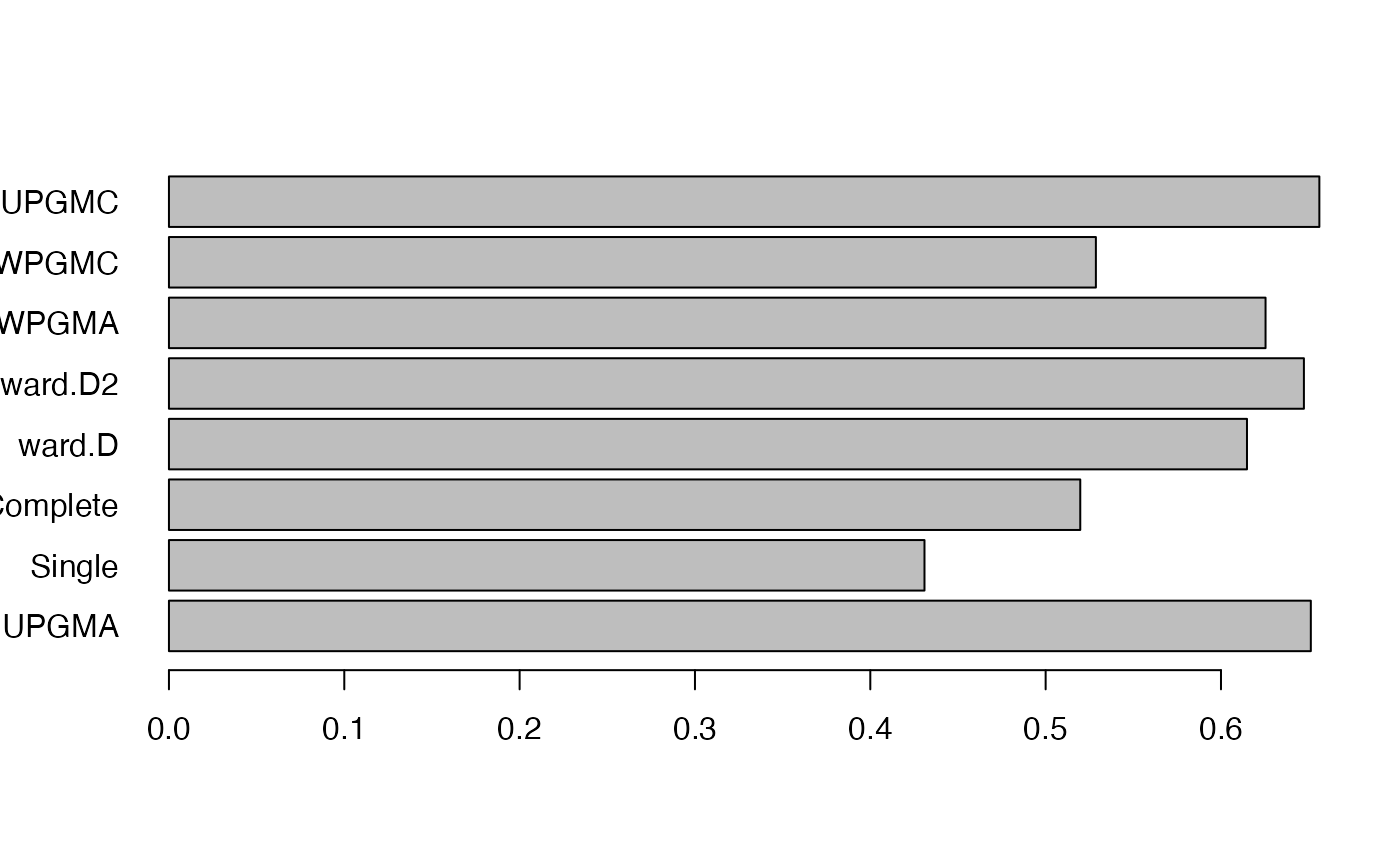
If plot = TRUE, a barplot of cophenetic correlation for all the clustering algorithms is drawn.
References
Sokal, R.R. & Rohlf, F.J. (1962) The comparison of dendrograms by objective methods. Taxon 11: 33–40.